Which marketing KPIs should a small business track?
Traffic, conversion rate, acquisition cost, average basket and loyalty: the marketing metrics that matter for a small business and how to track them.
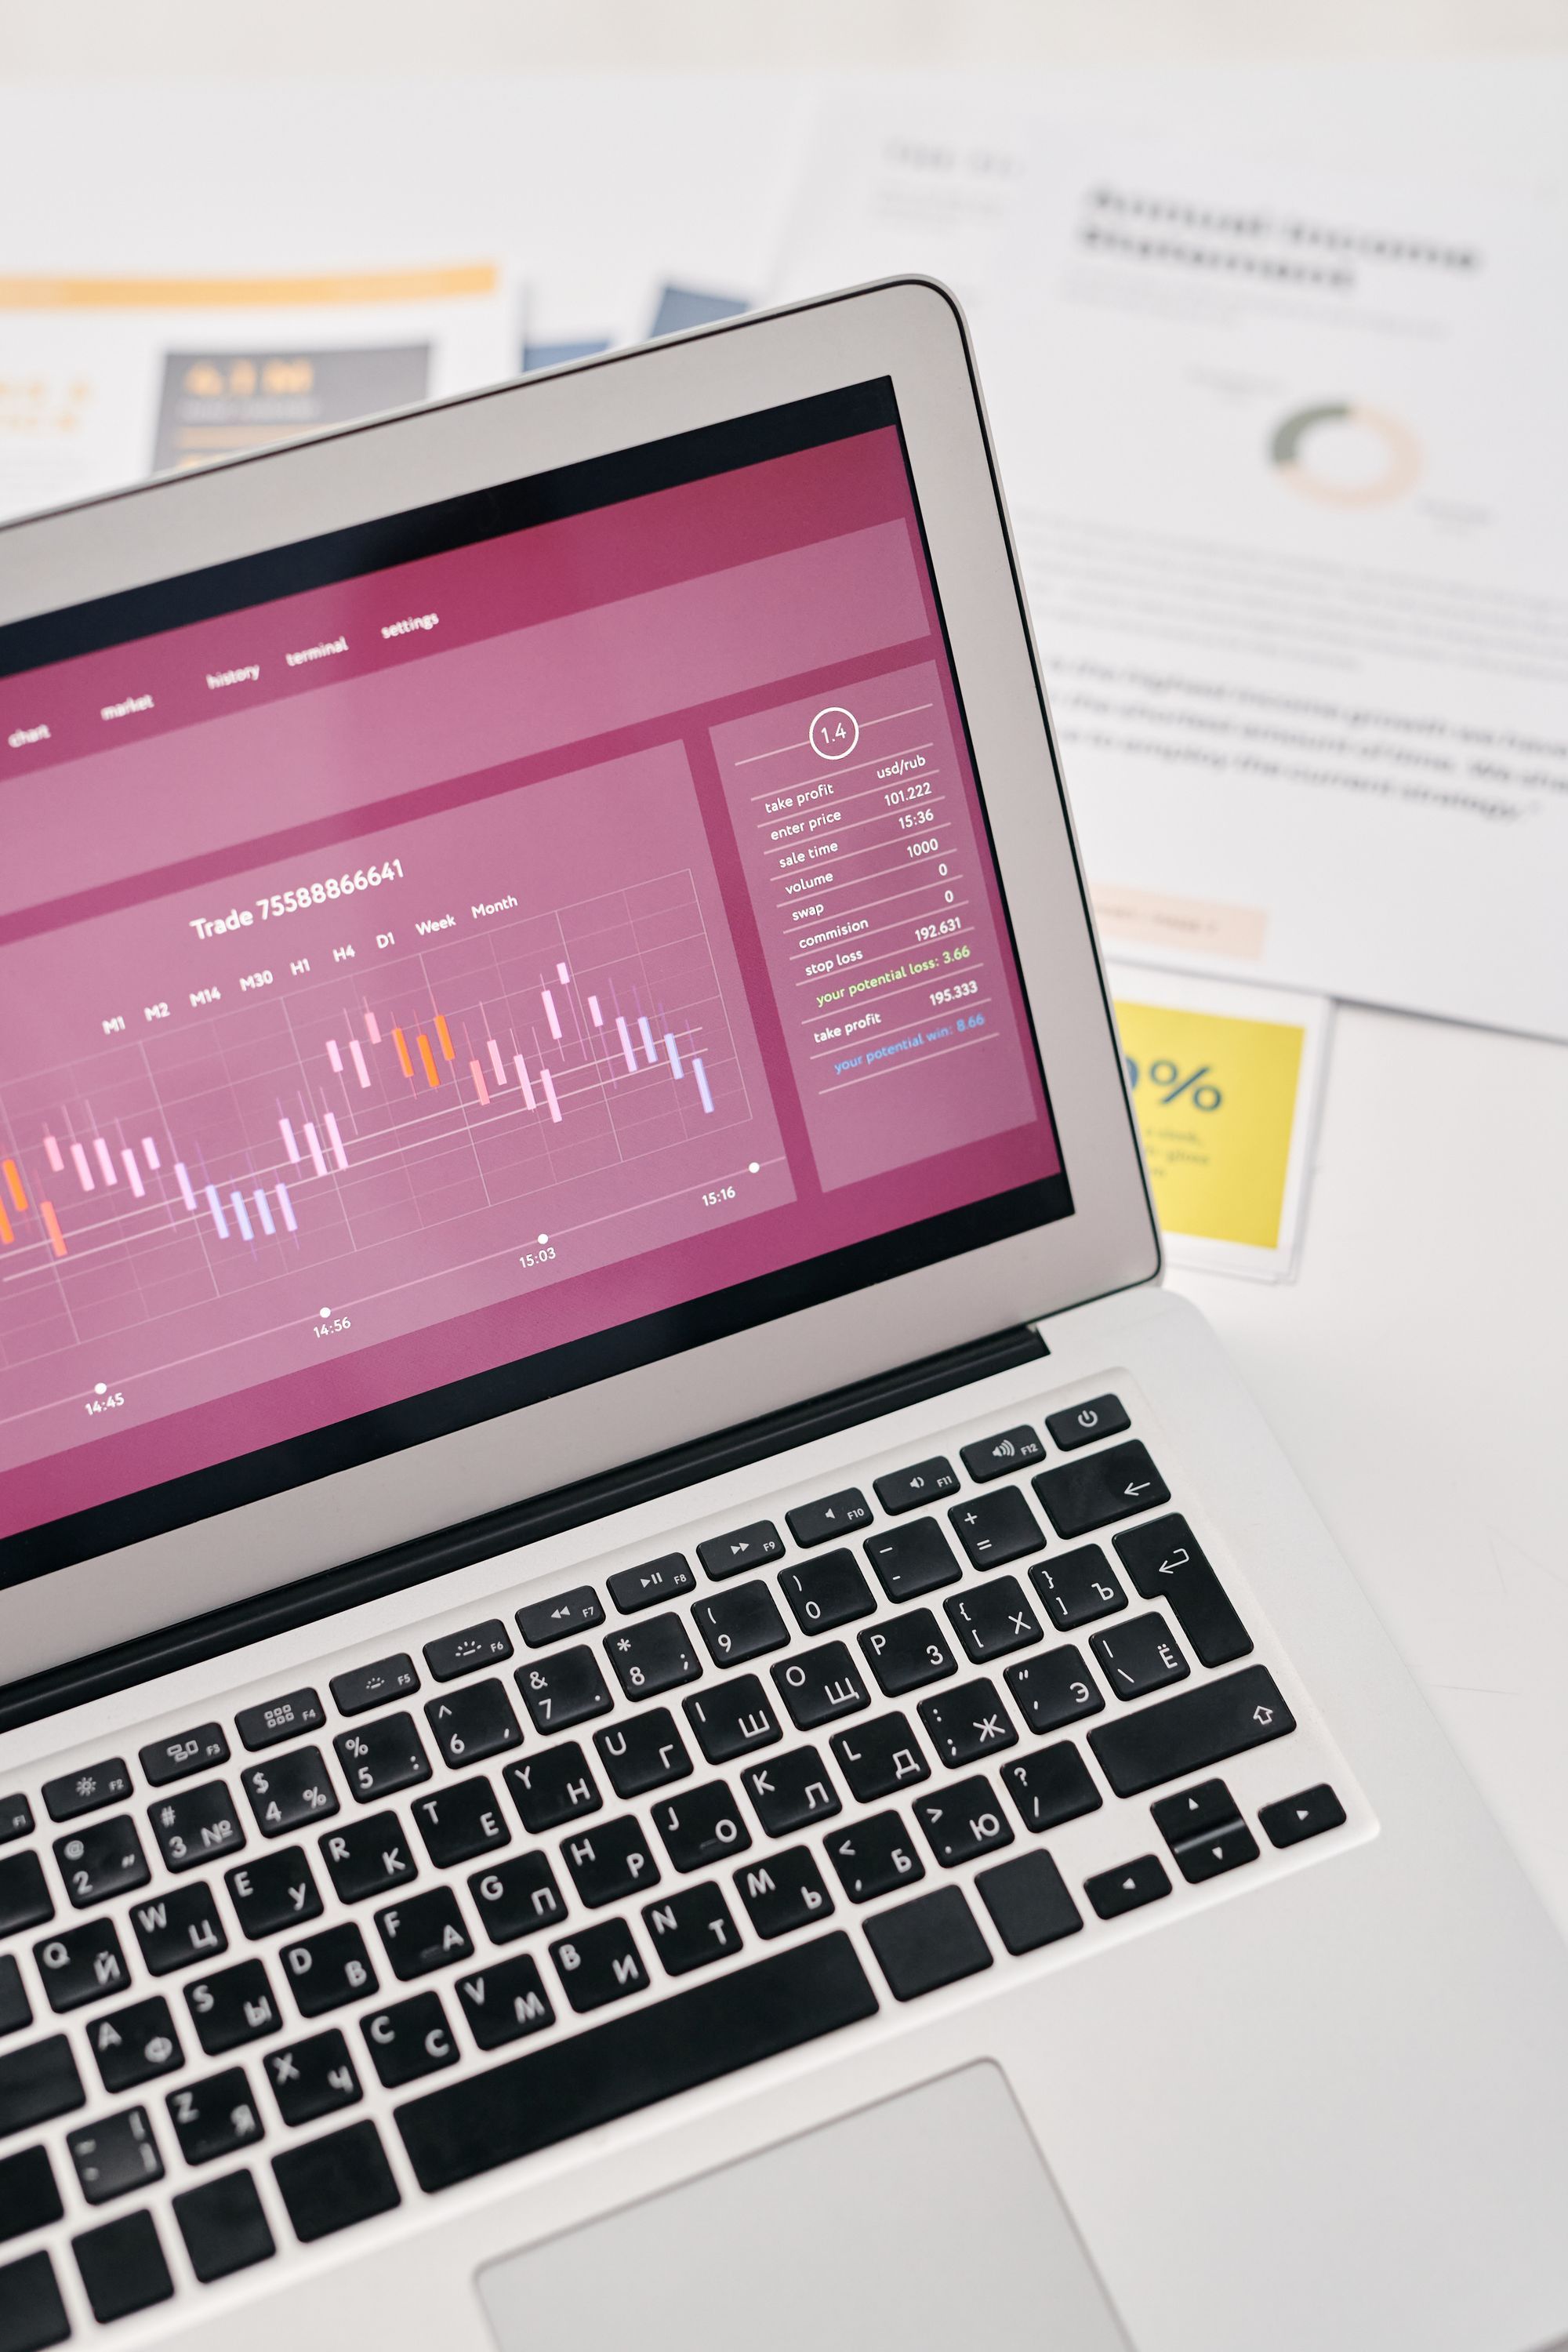
Analytics tools provide hundreds of numbers. The risk isn’t a lack of data but drowning in it. For a small business, a handful of well-chosen indicators is enough to steer marketing and make better decisions. Here is which ones to track, and how.
One principle: start from your goals
A KPI (key performance indicator) only makes sense if it is linked to a goal. If your goal is more quote requests, your Instagram follower count isn’t your main indicator. So start from your goals, as explained in our annual marketing plan method.
Attraction metrics
- Website visits and how they evolve month to month.
- Traffic sources: Google search, social media, referring sites, direct, campaigns.
- Local visibility: views and actions on your Google profile (calls, directions, website clicks).
- Impressions and clicks in Google (Search Console): which searches you appear for.
These numbers tell you whether you are being found. They don’t tell you whether you are selling.
Conversion metrics
- Number of conversions: purchases, quote requests, bookings, calls.
- Conversion rate: conversions ÷ visits. This is the metric to watch before investing in more traffic. See our 12 levers to improve it.
- Sales close rate: the share of enquiries that become customers.
Profitability metrics
- Customer acquisition cost (CAC): marketing spend for a period ÷ new customers won in the same period.
- Average basket: revenue ÷ number of orders.
- Campaign return on investment: revenue or margin generated ÷ campaign cost.
These three answer the essential question: does this action bring in more than it costs?
Loyalty metrics
- Returning customer rate over a period.
- Purchase or visit frequency.
- Customer reviews: number, average rating, trend.
- Email marketing: open and click rates, unsubscribes.
Keeping a customer often costs less than winning a new one: these metrics deserve as much attention as traffic.
Build a simple dashboard
A spreadsheet is enough to start:
- one row per month;
- one column per indicator (8 to 10 at most);
- a reliable source for each figure (analytics, Search Console, till or online store software, email tool);
- a comments row: what happened that month (campaign, trade show, new menu).
Fill it in at the start of each month. Within a few months, useful trends will emerge.
Classic pitfalls
- Vanity metrics: followers, likes or page views are nice to look at but say little about your sales.
- Comparing incomparable periods: July against November, ignoring seasonality.
- Skewed data: check your conversions are properly tracked and internal visits excluded.
- Measuring without deciding: a metric that never triggers an action is useless.
Frequently asked questions
How many indicators should I track? Between five and ten for a small business. Beyond that, the dashboard becomes hard to read and maintain.
Is tracking GDPR-compliant? Yes, provided you collect consent for non-exempt analytics cookies and configure your tools properly.
We can build your dashboard
KPI analysis and setting up tracking tools are part of our marketing strategy and consulting service. Let’s talk during your free first audit.